Imagine you are trying to analyse a city, and you want primarily to understand its structure. You look at buildings, their dimensions and patterns they form, you look at a street network, and then you want to understand detailed patterns of density. This last point requires a specification of an aerial unit, and morphological tessellation is one of the most detailed options.
I don’t want to talk only about density, but let’s use it as an illustration.
Let’s say that we want as high resolution of our data as possible, so we need the smallest spatial unit we can get. That is often a plot.
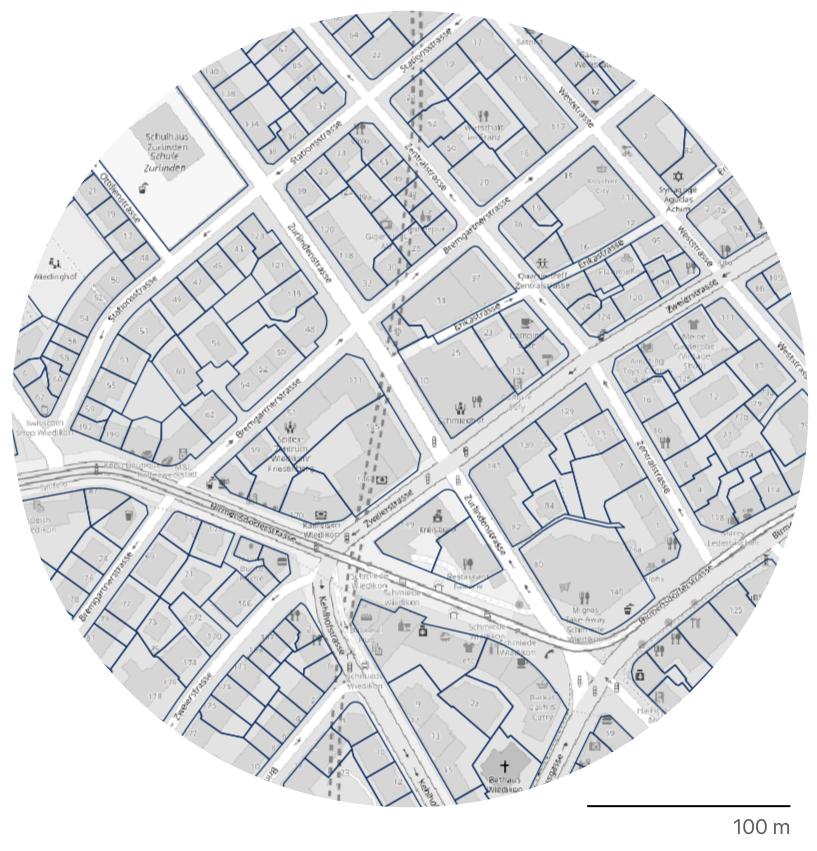
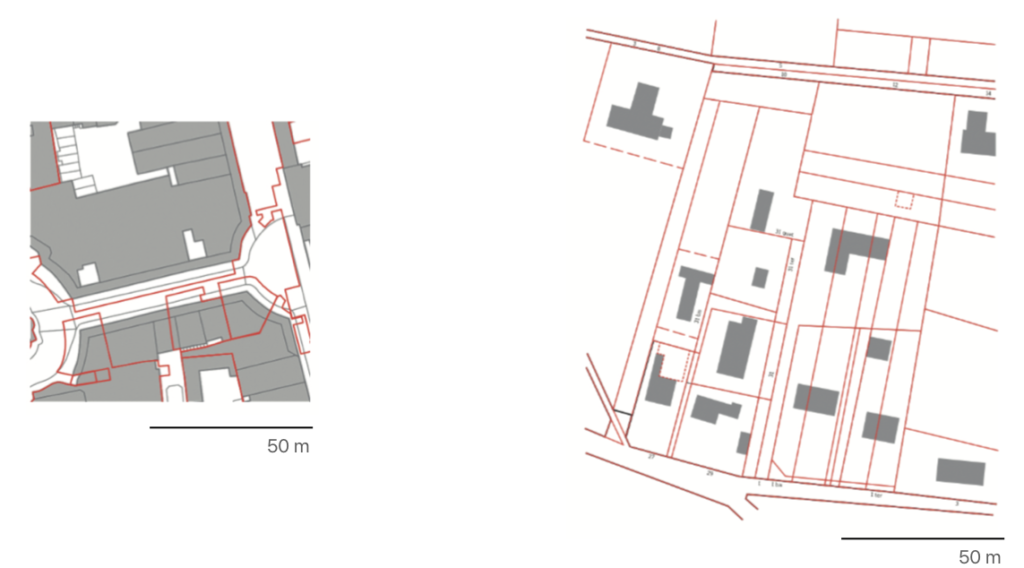
But the reality is not so simple. Firstly, you need to get a layer representing plots. Here you may be lucky and find one, nice and clean, which you can use for the analysis. However, if you try to the same thing for another city on another continent, you quickly figure out that the situation is becoming tricky. Plots have various definitions - each country captures them differently 1. So, in the end, your plots from different places are not representing the same concept, and your results are not comparable.2
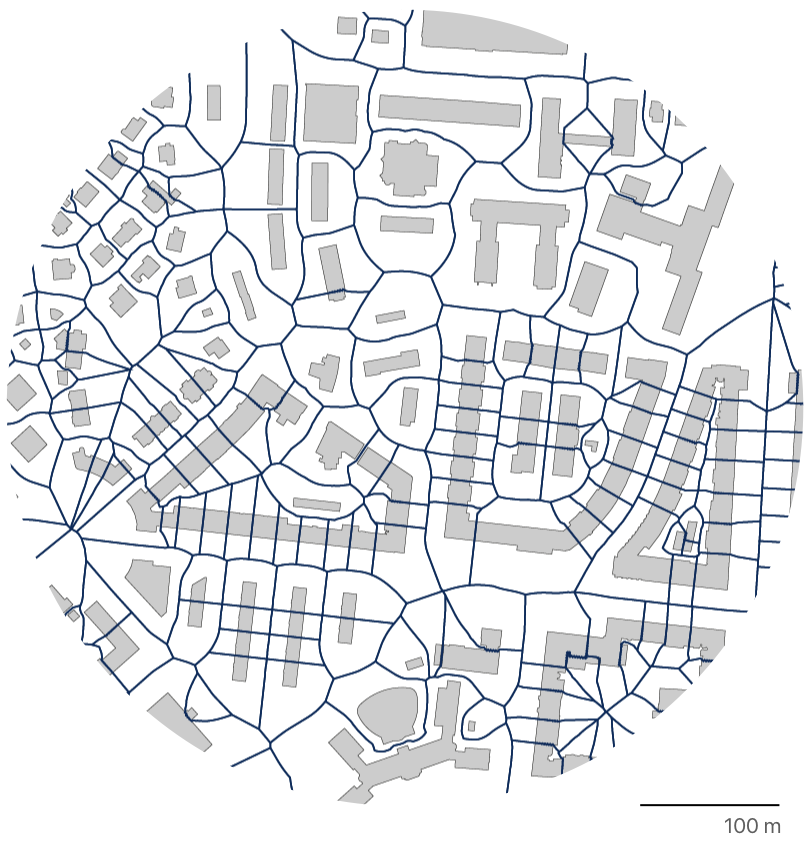
One possible solution is to use morphological tessellation as a spatial unit instead. Its principle is simple - it is a Voronoi tessellation based on building footprint polygons. In practice, each building polygon is represented as a series of points capturing its boundaries. Points are used to generate Voronoi, and relevant cells are dissolved to get a single cell representing tessellation cell based on a single building.3
In our recent paper, we have tested morphological tessellation from two perspectives - 1) what are the optimal parameters for its creation, and 2) how good proxy of a plot tessellation is.
There are a few important findings to mention. First, there are contexts where tessellation can directly replace a plot in the analysis. One example is the density mentioned above - both coverage area ratio, and floor area ratio could be easily measured based on tessellation. Second, tessellation has some advantages over the plot - it is consistent and contiguous.
Tessellation captures any kind of urban form (historical, modernist, industrial…) in the same, consistent manner. That makes the tessellation cells across the case studies perfectly comparable, even in situations when plots are not available at all (like some informal settlements) or capture non-morphological spatial division (like contemporary large-scale development with multiple buildings on a single plot).
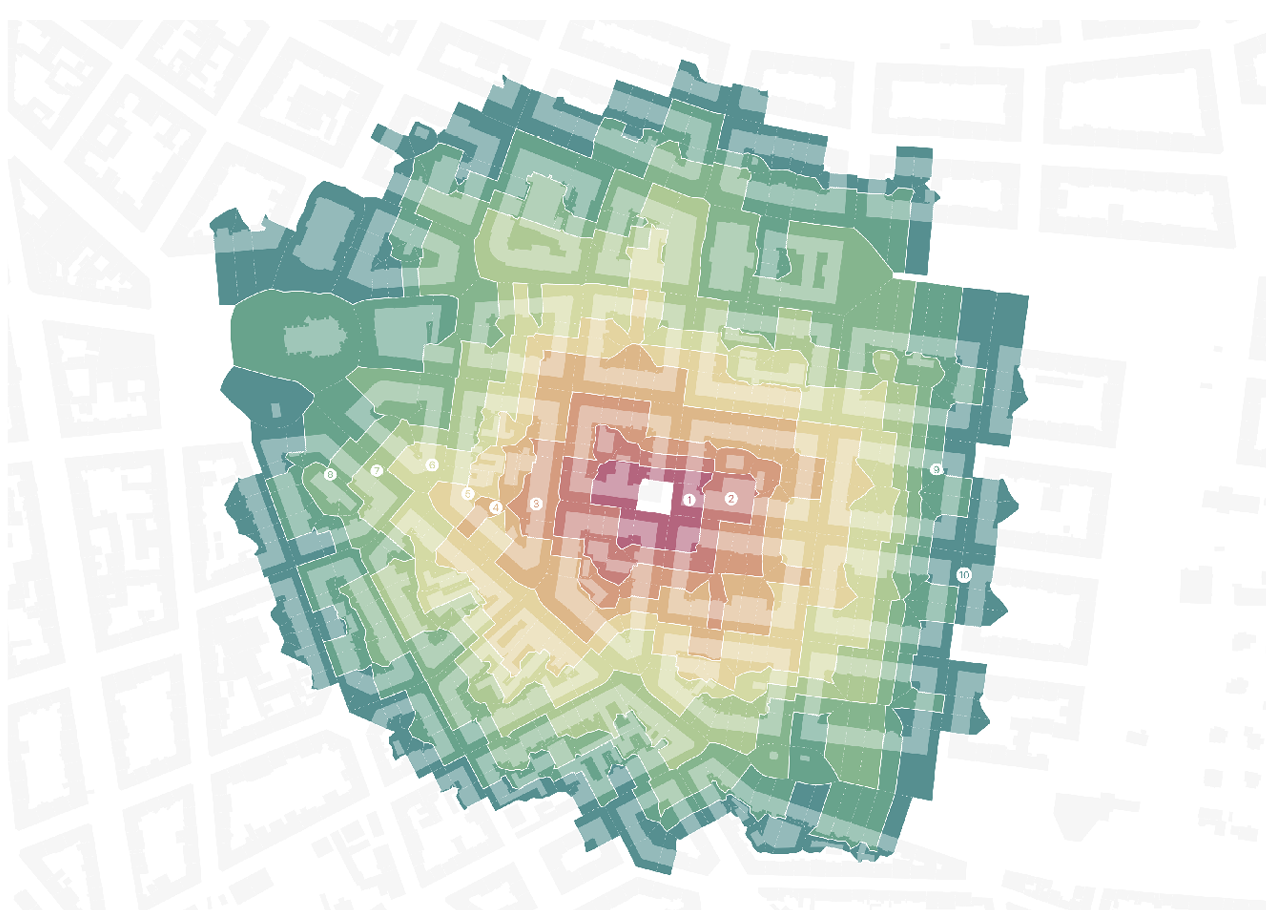
Unlike plots, morphological tessellation is contiguous, allowing for the definition of adjacency between buildings in situations, where it normally would not be so clear.
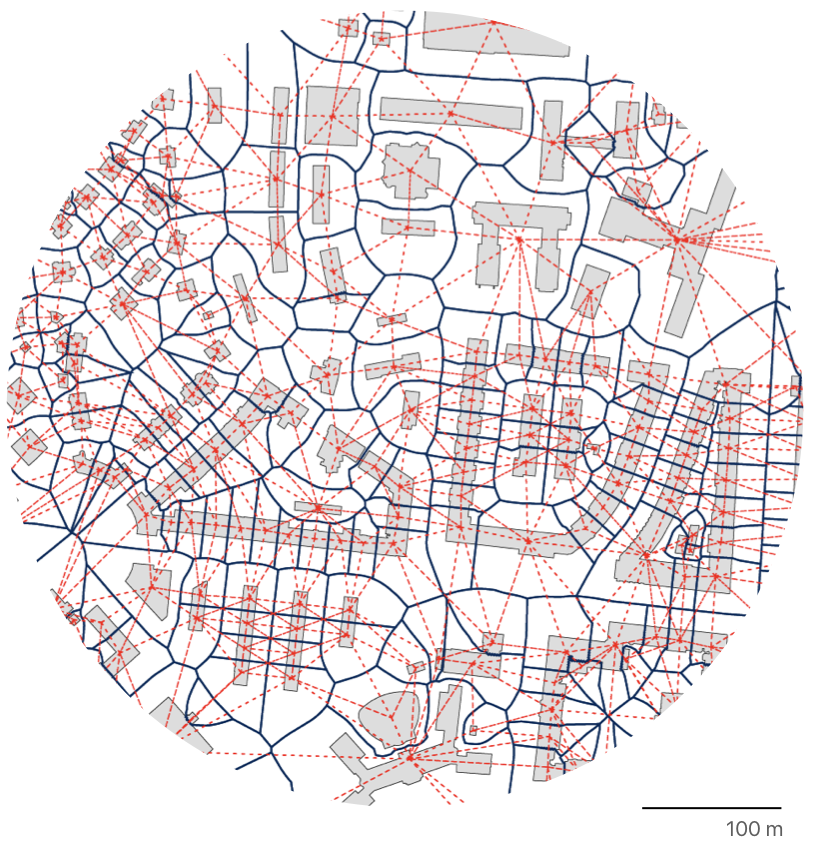
That, in turn, allows spatial aggregation, based on the aerial topology of space. Just pick a number of topological steps you like.
Our implementation of morphological tessellation is a part of momepy Python package, coming with a tutorial on how to generate tessellation on your data or on data from OpenStreetMap.
The published version of our article Morphological tessellation as a way of partitioning space: Improving consistency in urban morphology at the plot scale is available from CEUS website, the repository with the Python code and data we have used within the research is available on GitHub and archived here.
The second image in this article is reproduced from Kropf, K. (2018) ‘Plots, property and behaviour’, Urban Morphology, 22(1), pp. 5–14.
Fleischmann, M., Feliciotti, A., Romice, O. and Porta, S. (2020) ‘Morphological tessellation as a way of partitioning space: Improving consistency in urban morphology at the plot scale’, Computers, Environment and Urban Systems, 80, p. 101441. doi: 10.1016/j.compenvurbsys.2019.101441.
Kropf, K. (2018) ‘Plots, property and behaviour’, Urban Morphology, 22(1), pp. 5–14. ↩︎
An additional issue with plots comes with modernist housing development, where the plot does not have a structural role, but that is a whole another story. ↩︎
There are algorithms which can do tessellation based on polygon directly (e.g. CGAL library), but point-based implementation is much easier to do in Python, R or even QGIS and the result is almost the same. ↩︎