This is the map we have created for the Urban Grammar AI project. It is created using open source software stack and hosted on GitHub, for free.
This post will walk you through the whole process of generation of the map, step by step, so you can create your own. It is a bit longer than usual, so a quick outline for better orientation:
By the end of this tutorial, you will be able to take your vector data and turn them into a fully-fledged vector map hosted on GitHub with no cost involved, for everyone to enjoy.
Vector tiles
Web maps are (usually) based on tiles. That means that every dataset is turned into a large set of tiny squares representing small portions of the map. And if you want to zoom in and out, you need those tiles for every zoom level. So the first step in our process will be the creation of vector tiles.
The easiest option is to use tippecanoe, a tool created by Mapbox that allows you to create vector tiles from any GeoJSON input. You should export only the columns you need and make sure that the geometry is in EPSG:4326 projection (lat/long) - that is what tippecanoe expects. Something like this will do if you have your data in geopandas.GeoDataFrame:
gdf[["signature_type", "geometry"]].to_crs(4326).to_file(
    "signatures_4326.geojson"
)
Now you have a signatures_4326.geojson with geometry and a column encoding the signature type. It means that it is time to use tippecanoe (check the installation instructions).
tippecanoe is a command-line tool, so fire up your favourite terminal, or use it within a Jupyter notebook (as we did). There are some options to set but let’s talk about the most important ones (you can check the rest in the documentation).
Zoom levels
Every map has a range of zoom levels at which the shown data is meaningful. If you’re comparing states, you don’t need to zoom to a level of a street, and if you’re showing building-level data, you don’t need a zoom to see the whole continent.
Zoom level 0 means you are zoomed out to see the whole world. It is a single tile. Zoom level 1 is a bit closer and is split into 4 tiles. Zoom level 2 has 16 tiles, level 3 has 64 and so on. Zoom level 16, which shows a street-level detail, consists of 4 294 967 296 tiles if you want to create them for the whole world. That is a lot of data, so you need to be mindful of which detail you actually need because the difference between zooming up to level 15 and up to level 16 is huge. OpenStreetMap has a nice guide on zoom levels if you are interested in more details.
For the signature geometry that represents neighbourhood-level classification, level 15 feels like the reasonable maximum, so you have the first option - -z15.
Tile format and compression
In later steps, you will use the Leaflet.VectorGrid plugin to load the tiles. To make that work, you need them as uncompressed protobuf files (not Mapbox vector tiles), which gives you another two options - -no-tile-compression to control the compression and --output-to-directory telling tippecanoe to use directories, instead of mbtiles.
We have used a few more options, but you may not need those.
Generate tiles
You have all you need to create the tiles:
tippecanoe -z15 \
           --no-tile-compression \
           --output-to-directory=tiles/ \
           signatures_4326.geojson
The command above sets the maximum zoom to 15 so you don’t create overly detailed tiles (z15), disables tile compression (--no-tile-compression) and saves the result to the tiles/ directory (--output-to-directory=tiles/), based on your GeoJSON file (signatures_4326.geojson).
This step may take a bit of time, but once it is done, you will see thousands of files in the tiles/ folder. It is time to show them on a map.
Leaflet.js map
One of the best tools for interactive maps is a leaflet.js, an open-source JavaScript library. With the right plugins, it is an ideal tool for almost any web map.
The whole map and a JavaScript code will be served from a single HTML file. Let’s start with some basic structure, with comments as a placeholder you will fill later:
<!DOCTYPE html>
<html>

<head>
    <title>Spatial Signatures in Great Britain</title>
    <meta charset="utf-8" />
    <meta name="viewport" content="width=device-width, initial-scale=1.0">
        <!-- load leaflet.js -->
</head>

<body style='margin:0'>
        <!-- div containing map -->
        <!-- specification of leaflet map -->
</body>

</html>
Load leaflet.js
To load the leaflet.js, you need to get its source script and CSS styles. Both are usually fetched over the web. You can then replace <!-- load leaflet.js --> with the following snippet:
<!-- load leaflet.js -->
<!-- load CSS -->
<link rel="stylesheet" href="https://unpkg.com/leaflet@1.7.1/dist/leaflet.css"/>

<!-- load JS -->
<script src="https://unpkg.com/leaflet@1.7.1/dist/leaflet.js"></script>
However, the basic leaflet.js is not able to work with vector tiles, so you need to load a Leaflet.VectorGrid extension on top. Just add this to the snippet:
<!-- load VectorGrid extension -->
<script src="https://unpkg.com/leaflet.vectorgrid@1.3.0/dist/Leaflet.VectorGrid.bundled.js"></script>
At this moment, you have everything you need to create the map in your file.
Create the map
You need two things - a div object where the map will live and a bit of JavaScript specifying what the map should do. The former is easy:
<!-- div containing map -->
<div id="map" style="width: 100vw; height: 100vh; background: #fdfdfd"></div>
This div is empty, but the important bit is id="map", which will link it to the JavaScript. It also has some basic styles ensuring that it covers the whole screen (width: 100vw; height: 100vh;) and has an almost-white background (background: #fdfdfd).
The second part is the actual JavaScript generating the map.
<script>
// create map
var map = L.map('map', {
    center: [53.4107, -2.9704],
    minZoom: 6,
    maxZoom: 15,
    zoomControl: true,
    zoom: 12,
});

// other map specifications
</script>
Let’s unpack this. This creates a variable called map (var map), which is a leaflet map object (L.map). The object is linked to the HTML element (in this case div) with the id map you created above (“map”). It also has a dictionary with some basic specification, that is setting the centre of the map to Liverpool (center: [53.4107, -2.9704] where the numbers are latitude and longitude), limiting zoom levels to 6-15 (minZoom: 6 and maxZoom: 15), turning on zoom control (+- buttons) (zoomControl: true) and setting the default zoom to 12 (zoom: 12). The zoom level 6, selected as a minimum, is approximately the level on which you see the whole of Great Britain. Since spatial signatures cover only GB, there’s no need to zoom further away. Maximum zoom 15 mirrors the maximum zoom of tiles we generated earlier. You would get no tiles if you zoomed closer than that.
The map object is ready! There’s nothing there now, but that will change soon.
Add a base map
It is nice to have some base map in there before adding other layers, just to make sure everything works. You can add a default OpenStreetMap or something more subtle as a CartoDB Positron map.
// add background basemap
var mapBaseLayer = L.tileLayer(
    'https://{s}.basemaps.cartocdn.com/rastertiles/light_all/{z}/{x}/{y}.png', {
        attribution: '(C) OpenStreetMap contributors (C) CARTO'
    }
).addTo(map);
This creates a leaflet tile layer (L.tileLayer) with the URL of CartoDB raster XYZ tiles and attribution of the origin of tiles. Finally, it adds the layer to our map (.addTo(map)). Now you can actually see a real map.
Add vector tiles
Now for the key part - vector tiles. We need to define quite a few things here.
URL
Let’s first set an URL to each tile.
// get vector tiles URL
var mapUrl = "tiles/{z}/{x}/{y}.pbf";
Tiles are in the tiles/ folder where tippecanoe dumped them. They are organised into folders, following the XYZ tiling standard. That means that they are organised according to zoom level ({z}) and tile coordinates within each level ({x} and {y}). You then need to specify the URL to tiles with placeholders that will be automatically filled by leaflet.js. Here you save the URL to the variable mapUrl.
Options
Another variable you may want to specify is a dictionary with options for the tiles.
// define options of vector tiles
var mapVectorTileOptions = {
    rendererFactory: L.canvas.tile,
    interactive: true,
    attribution: '(C) Martin Fleischmann',
    maxNativeZoom: 15,
    minZoom: 6,
};
The snippet creates a variable (mapVectorTileOptions) and specifies that the tiles should be rendered using leaflet (rendererFactory: L.canvas.tile), they should allow interactivity (interactive: true) as we will need it later, it sets the attribution (attribution: '(C) Martin Fleischmann') and min and max zoom levels.
Vector tile layer
Now you can define the vector tile layer itself.
var mapPbfLayer = new L.VectorGrid.Protobuf(
    mapUrl, mapVectorTileOptions
)
This creates a new variable (mapPbfLayer) to store vector grid protobuf layer (new L.VectorGrid.Protobuf) based on the URL and tile options specified above.
Add to map
Finally, you can add the created layer to the map.
// add VectorGrid layer to map
mapPbfLayer.addTo(map);
At this point, you should be able to see your vector tiles on your map with no styles. However, to be able to use it locally, you need to start a server first. An easy way is to do it with Python. In the terminal, navigate to the folder with your html file (something like cd path/to/my_folder) and start the http server:
python -m http.server 8000
If you now open http://localhost:8000 in your browser, you should be able to open your html file (it will open automatically if it is called index.html) and see your map. It should look like this:
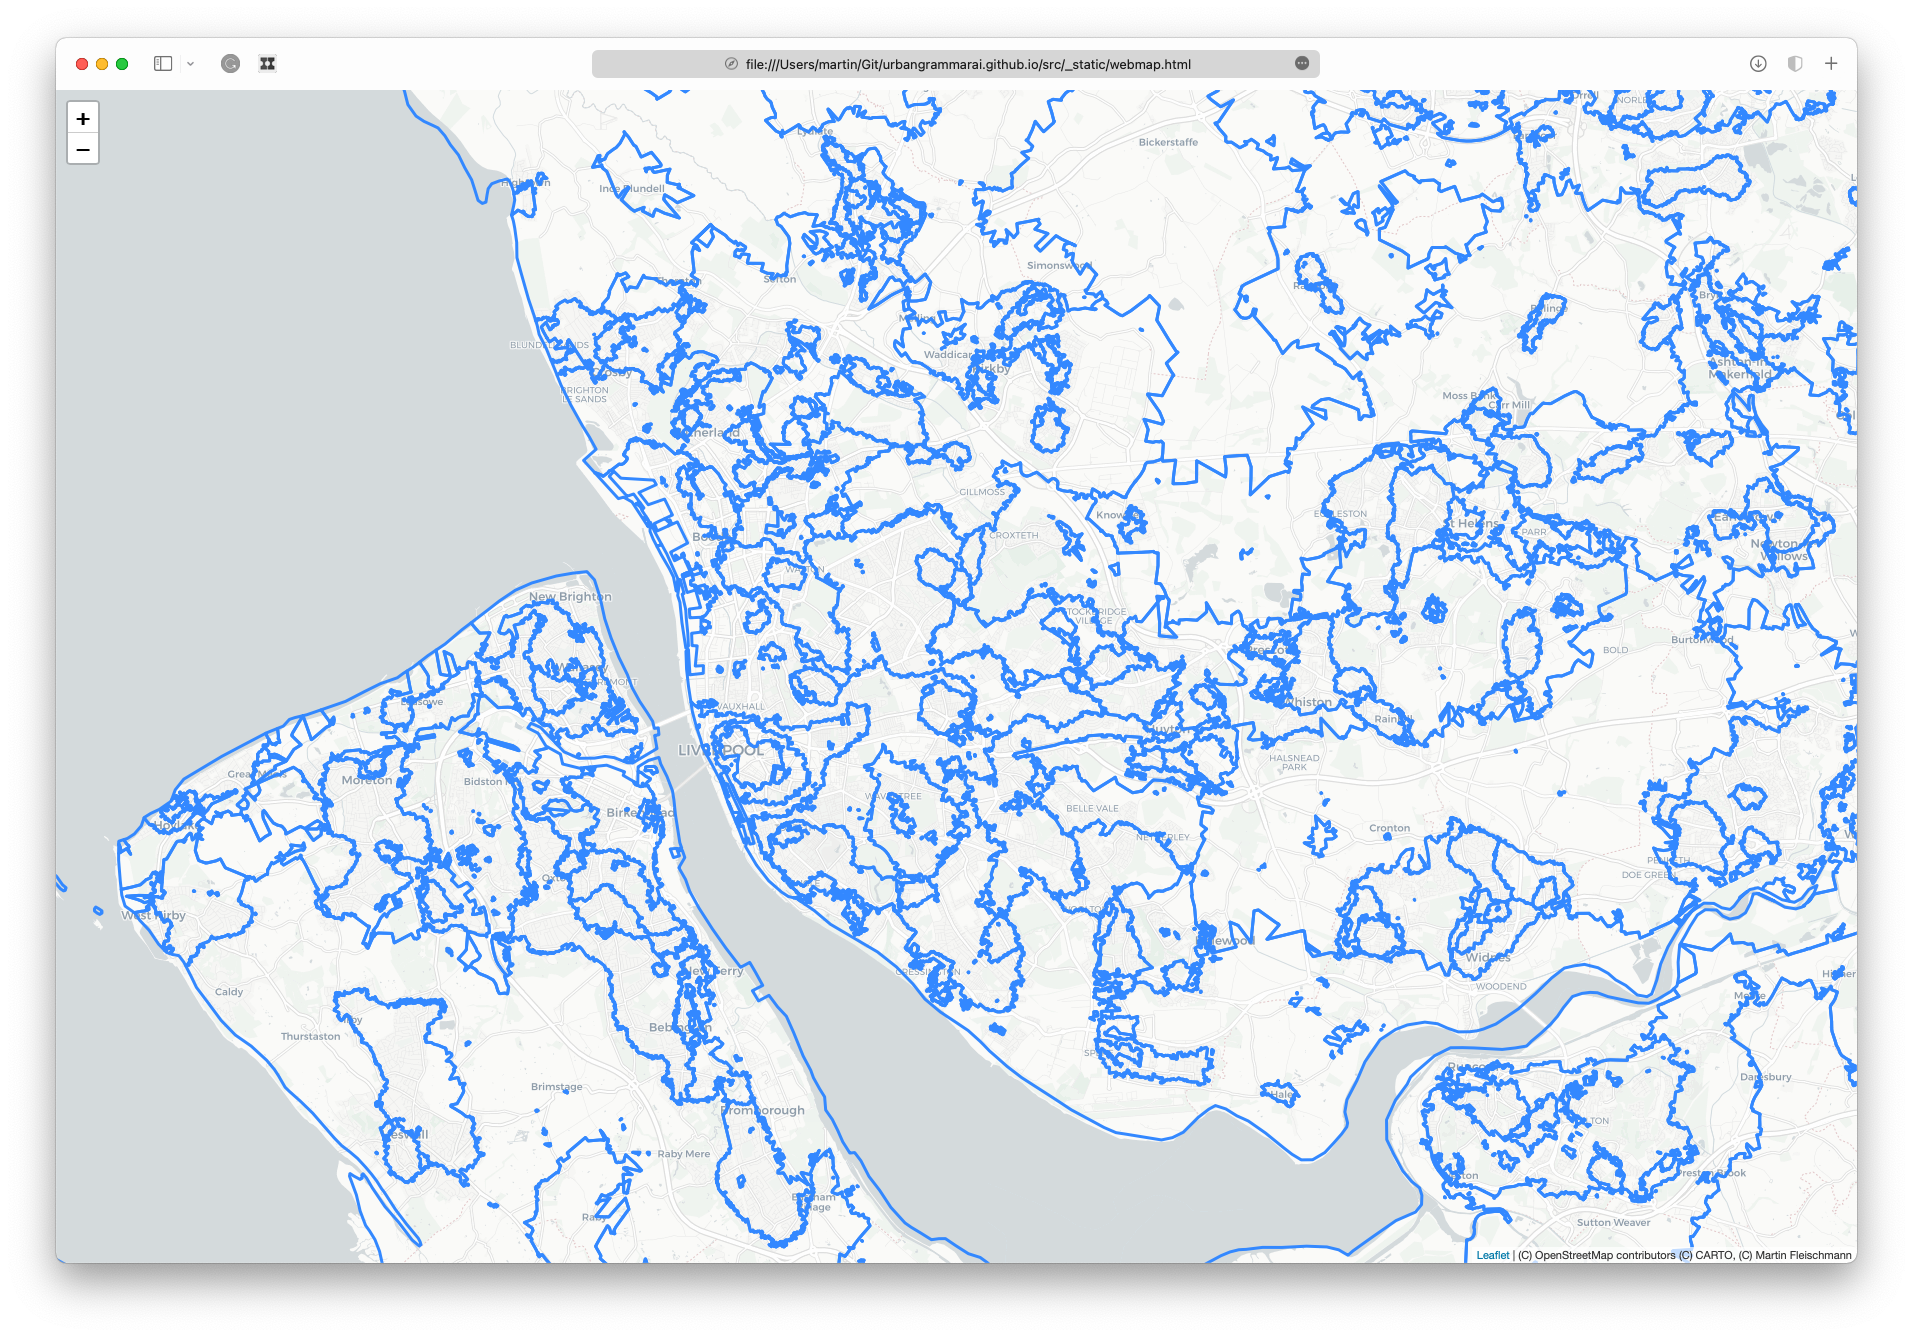
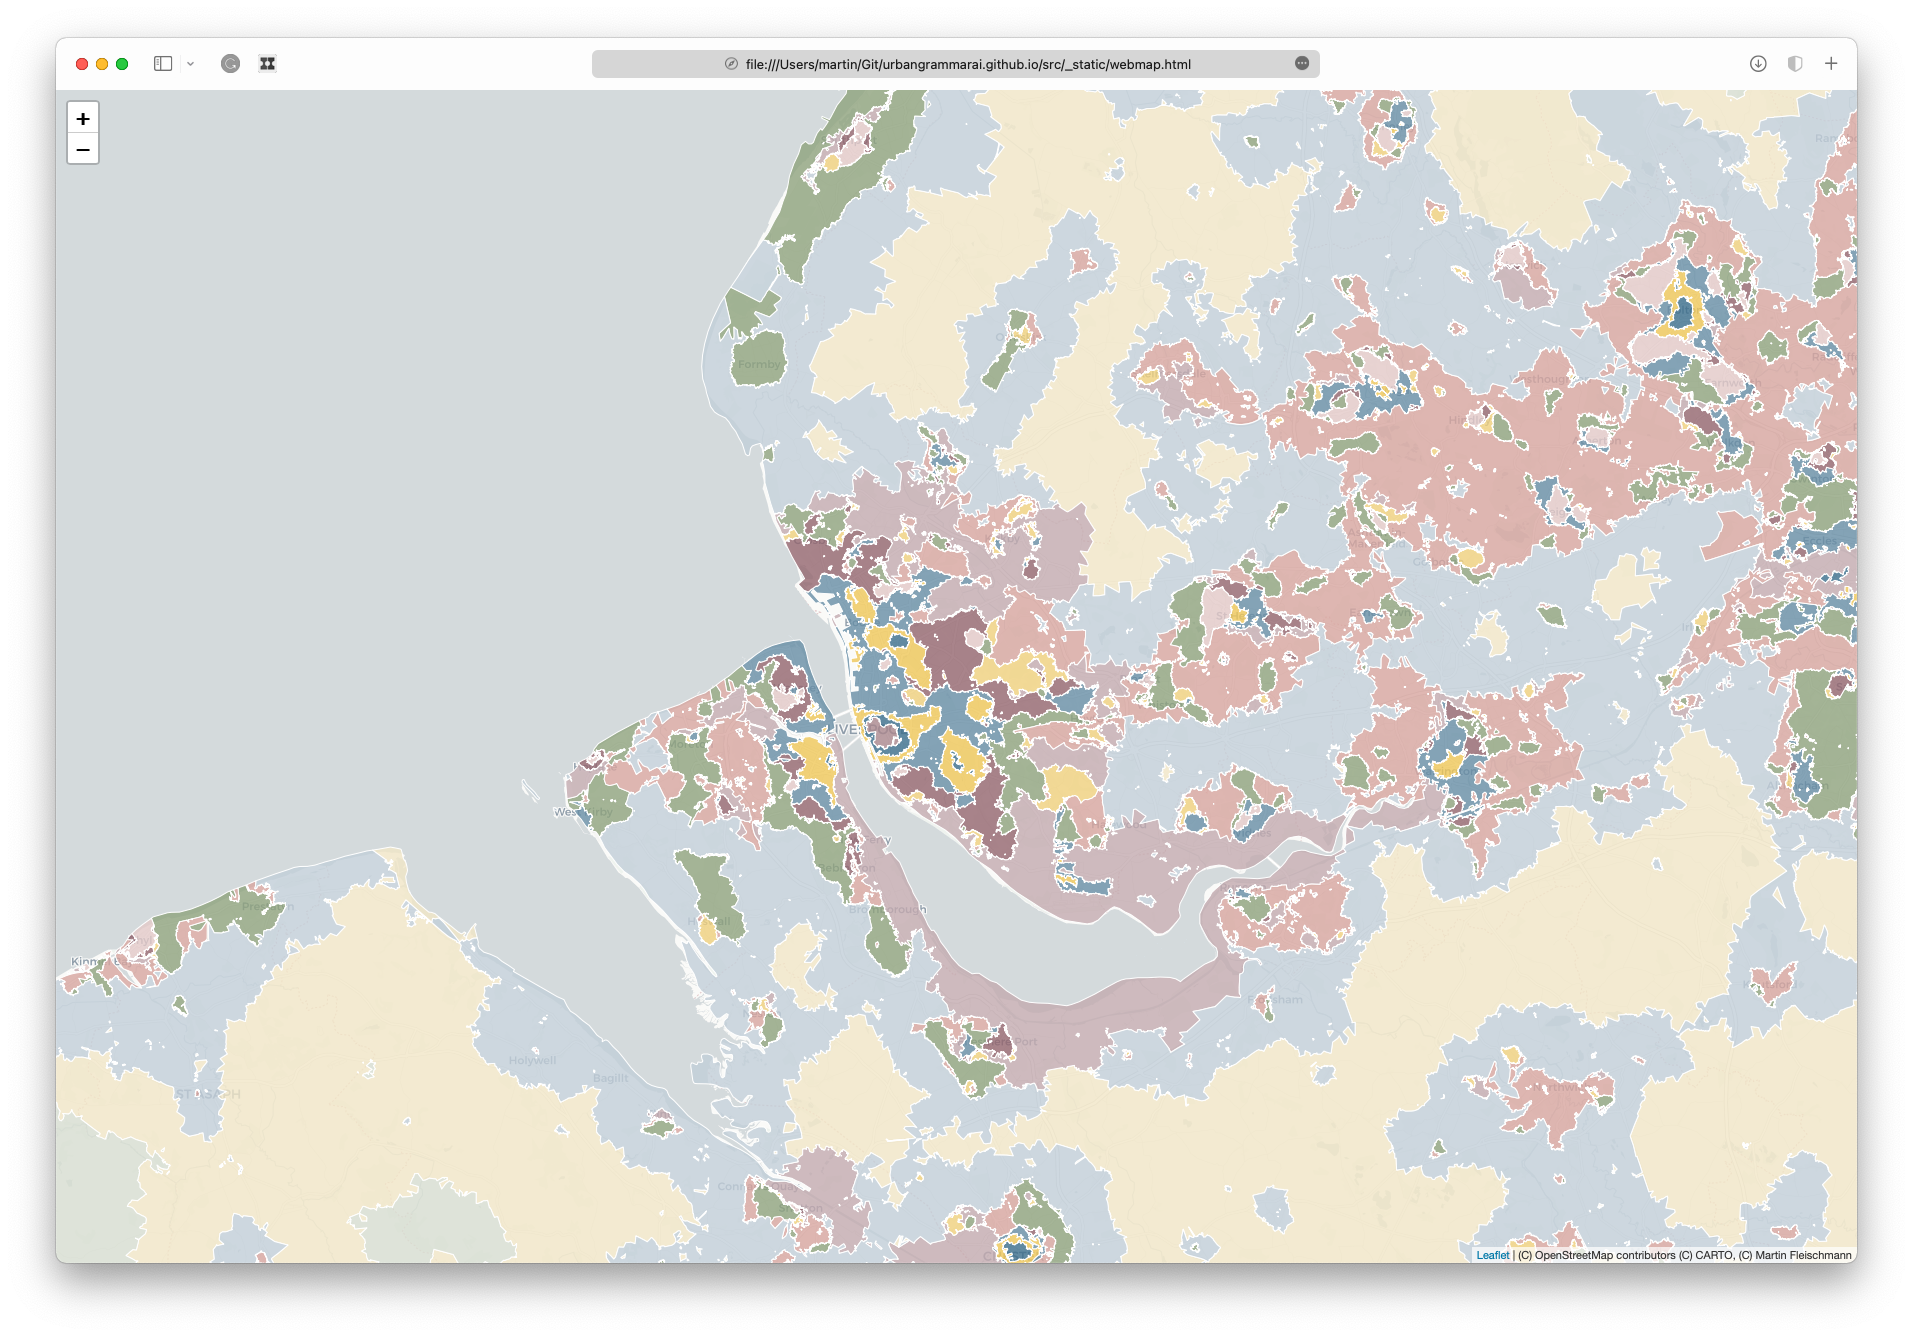
Style the tiles
The GeoJSON used to create these tiles has a single attribute column called signature_type. What you want to do now is to use this column to style the map to your liking.
Let’s assume that you know which RGB colours should apply to which signature type code. Let’s save those in a dictionary, so you can use them later.
// mapping of colors to signature types
const cmap = {
    "0_0": "#f2e6c7",
    "1_0": "#8fa37e",
    "3_0": "#d7a59f",
    "4_0": "#d7ded1",
    "5_0": "#c3abaf",
    "6_0": "#e4cbc8",
    "7_0": "#c2d0d9",
    "8_0": "#f0d17d",
    "2_0": "#678ea6",
    "2_1": "#94666e",
    "2_2": "#efc758",
    "9_0": "#3b6e8c",
    "9_1": "#333432",
    "9_2": "#ab888e",
    "9_3": "#c1c1c0",
    "9_4": "#bc5b4f",
    "9_5": "#a7b799",
    "9_6": "#c1c1c0",
    "9_7": "#c1c1c0",
    "9_8": "#c1c1c0"
};
This dictionary is easy left side encodes the signature type code, right side the colour as a HEX code.
Having colours, let’s define a new variable with styles and unpack it a bit.
// define styling of vector tiles
var vectorTileStyling = {
    signatures_4326: function(properties) {
        return ({
            fill: true,
            fillColor: cmap[properties.signature_type],
            fillOpacity: 0.9,
            weight: 1,
            color: "#ffffff",
            opacity: 1.0,
        });
    }
}
You need to create a function mapping the styles to geometries based on the signature type property. For layer signatures_4326 (that matches the name of input GeoJSON), you shall define a function that can use the layer properties (function(properties)) and specify that we want to fill each polygon with a colour (fill: true), that the fill colour should use the signature type to retrieve the colour from the dictionary defined above (fillColor: cmap[properties.signature_type]) with the fill opacity 0.8 to see a bit of background through (fillOpacity: 0.9). It also specifies the outline of each polygon as a white line of a weight 1.
Then you just need to edit the vector tile options (the mapVectorTileOptions dictionary from above) and add tile styling.
        // ...
        minZoom: 6,
        vectorTileLayerStyles: vectorTileStyling,  // this line is new
};
At this point, the basic map is done, and you can try to get it online or style it a bit more (scroll below for that).
This is the whole code of the page for reference.
<!DOCTYPE html>
<html>

<head>
    <title>Spatial Signatures in Great Britain</title>
    <meta charset="utf-8" />
    <meta name="viewport" content="width=device-width, initial-scale=1.0">

    <!-- load leaflet.js -->
    <!-- load CSS -->
    <link rel="stylesheet" href="https://unpkg.com/leaflet@1.7.1/dist/leaflet.css" />

    <!-- load JS -->
    <script src="https://unpkg.com/leaflet@1.7.1/dist/leaflet.js"></script>

    <!-- load VectorGrid extension -->
    <script src="https://unpkg.com/leaflet.vectorgrid@1.3.0/dist/Leaflet.VectorGrid.bundled.js"></script>
</head>

<body style='margin:0'>
    <!-- div containing map -->
    <div id="map" style="width: 100vw; height: 100vh; background: #fdfdfd"></div>
    <!-- specification of leaflet map -->
    <script>
        // create map
        var map = L.map('map', {
            center: [53.4107, -2.9704],
            minZoom: 6,
            maxZoom: 15,
            zoomControl: true,
            zoom: 12,
        });

        // add background basemap
        var mapBaseLayer = L.tileLayer(
            'https://{s}.basemaps.cartocdn.com/rastertiles/light_all/{z}/{x}/{y}.png', {
                attribution: '(C) OpenStreetMap contributors (C) CARTO'
            }
        ).addTo(map);

        // get vector tiles URL
        var mapUrl = "tiles/{z}/{x}/{y}.pbf";

        // mapping of colors to signature types
        const cmap = {
            "0_0": "#f2e6c7",
            "1_0": "#8fa37e",
            "3_0": "#d7a59f",
            "4_0": "#d7ded1",
            "5_0": "#c3abaf",
            "6_0": "#e4cbc8",
            "7_0": "#c2d0d9",
            "8_0": "#f0d17d",
            "2_0": "#678ea6",
            "2_1": "#94666e",
            "2_2": "#efc758",
            "9_0": "#3b6e8c",
            "9_1": "#333432",
            "9_2": "#ab888e",
            "9_3": "#c1c1c0",
            "9_4": "#bc5b4f",
            "9_5": "#a7b799",
            "9_6": "#c1c1c0",
            "9_7": "#c1c1c0",
            "9_8": "#c1c1c0"
        };

        // define styling of vector tiles
        var vectorTileStyling = {
            signatures_4326: function(properties) {
                return ({
                    fill: true,
                    fillColor: cmap[properties.signature_type],
                    fillOpacity: 0.9,
                    weight: 1,
                    color: "#ffffff",
                    opacity: 1.0,
                });
            }
        }

        // define options of vector tiles
        var mapVectorTileOptions = {
            rendererFactory: L.canvas.tile,
            interactive: true,
            attribution: '(C) Martin Fleischmann',
            maxNativeZoom: 15,
            minZoom: 6,
            vectorTileLayerStyles: vectorTileStyling,
        };

        // create VectorGrid layer
        var mapPbfLayer = new L.VectorGrid.Protobuf(
            mapUrl, mapVectorTileOptions
        )

        // add VectorGrid layer to map
        mapPbfLayer.addTo(map);
    </script>
</body>

</html>
Github Pages
You can use GitHub Pages to host the whole map online. GitHub has a size limit for individual files of 100MB. Considering that the original GeoJSON has 2.2GB, that may sound like a problem. But remember that the data are now cut to small tiles, where the size of each is a few KB. You want to create a repository on GitHub, upload your tiles/ folder and the HTML file you have just created, called index.html and set up GitHub Pages hosting.
Once your data are uploaded, create an empty file called .nojekyll that tells GitHub Pages to use the repository as an HTML code as it is (what it really says is “do not use Jekyll to compile the page”) and go to Settings > Pages and enable GitHub Pages.
Your web map is live and accessible by anyone online. GitHub Pages settings show you the exact link. It is as easy as that.
Tip: Once you have everything set on GitHub, use github.dev to make the further changes to the HTML file avoid download and indexing of the whole repository (just hit
.when you are on GitHub in your repository).
Our map lives in the urbangrammarai/great-britain repository if you want to check the source code and is available on https://urbangrammarai.xyz/great-britain/ (we use the custom domain on GitHub Pages).
Further styling and interactivity
You may have noticed that our map has a couple of features on top of this. Let’s quickly go through those.
Labels on top of the map
You can use another XYZ base map that has just labels and load it on top of your tiles to see the names of places (or roads or something else). The order of layers matches the order in which you use .addTo(map).
Adding CartoDB Positron labels (this need to be after mapPbfLayer.addTo(map):
// add labels basemap
var mapBaseLayer = L.tileLayer(
    'https://{s}.basemaps.cartocdn.com/rastertiles/light_only_labels/{z}/{x}/{y}.png', {
        attribution: '(C) OpenStreetMap contributors (C) CARTO'
    }
).addTo(map);
Popup information
You may want to show some additional information when you click on the geometry. Let’s link show the name of the signature type based on its code. First, create a dictionary with the info:
// mapping of names to signature types to be shown in popup on click
const popup_info = {
    "0_0": "Countryside agriculture",
    "1_0": "Accessible suburbia",
    "3_0": "Open sprawl",
    "4_0": "Wild countryside",
    "5_0": "Warehouse/Park land",
    "6_0": "Gridded residential quarters",
    "7_0": "Urban buffer",
    "8_0": "Disconnected suburbia",
    "2_0": "Dense residential neighbourhoods",
    "2_1": "Connected residential neighbourhoods",
    "2_2": "Dense urban neighbourhoods",
    "9_0": "Local urbanity",
    "9_1": "Concentrated urbanity",
    "9_2": "Regional urbanity",
    "9_4": "Metropolitan urbanity",
    "9_5": "Hyper concentrated urbanity",
};
Then you need to link the on click popup element to the VectorGrid object.
// create VectorGrid layer
var mapPbfLayer = new L.VectorGrid.Protobuf(
    mapUrl, mapVectorTileOptions
).on('click', function (e) { // this line and below
    L.popup()
        .setContent(popup_info[e.layer.properties.signature_type])
        .setLatLng(e.latlng)
        .openOn(map);
});
Conditional formatting based on the zoom level
The white outline can be a bit think when you zoom out, but there is a way how you can control that. You can just specify the condition to a variable and pass the variable to the tile styling dictionary.
// define styling of vector tiles
var vectorTileStyling = {
    signatures_4326: function(properties, zoom) {
                // set line weight conditionally based on zoom
        var weight = 0;
        if (zoom > 12) {
            weight = 1.0;
        }
        return ({
            fill: true,
            fillColor: cmap[properties.signature_type],
            fillOpacity: 0.9,
            weight: weight, // pass the weight variable instead of a value
            color: "#ffffff",
            opacity: 1.0,
        });
    }
}
The function signature has a new zoom attribute you can use in the condition.
Legend and details
A legend and details are just custom HTML objects detached from the leaflet map. You can check the source code to see how they’re done.